SolutionFire, flood and forest-loss intelligence for Thailand
AI Flood and Disaster Alert System,from risk data to response.
An AI assistant for the people who protect forests and villages. It watches satellite detections, weather and maps, ranks what threatens people first, explains why in plain words, and drafts the response for a duty officer to approve before anything goes out.
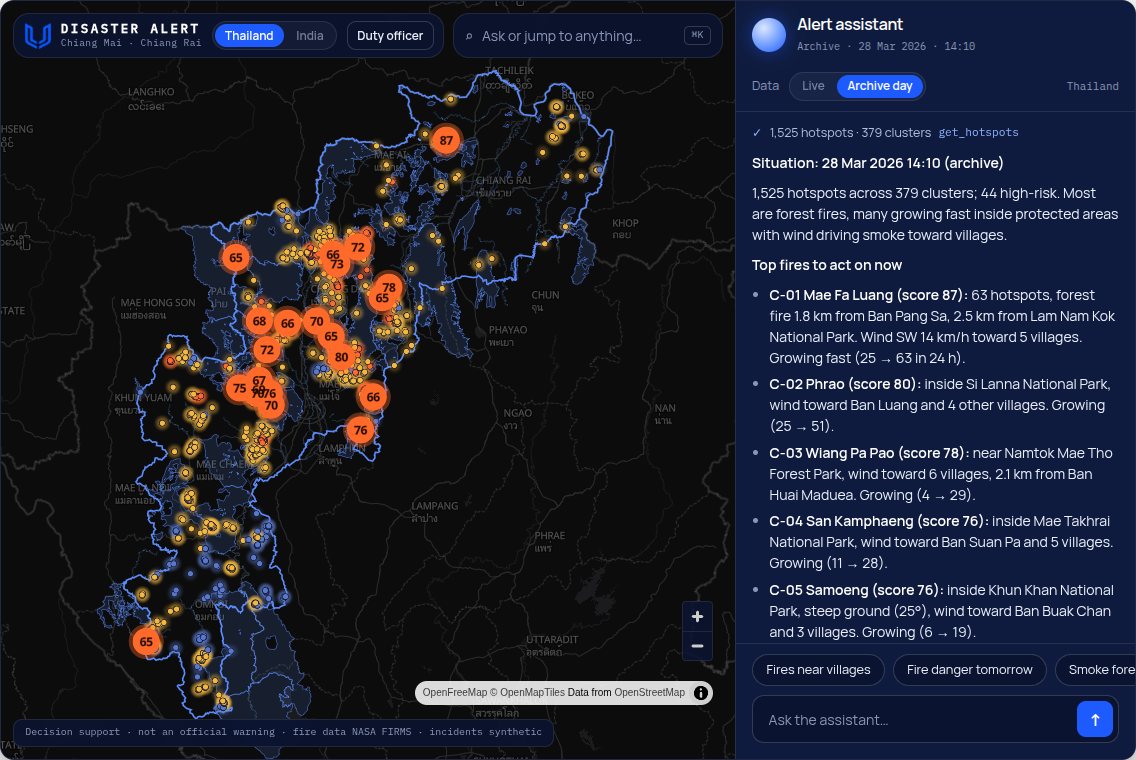
Real NASA FIRMS satellite fire detections for Chiang Mai and Chiang Rai on 28 Mar 2026. Incidents, people and teams are synthetic. Not an official warning.
The context
Flood response runs on scattered data and short lead times.
The signals that matter sit in different places and update at different speeds. The AI opportunity is to join them up, show where risk is building and why, and help people act on it sooner.
A seasonal risk
Much of Thailand's flood risk builds during the rainy season, broadly from around May to October, when heavy rain and rising rivers can coincide.
Fast and slow floods
Flash floods can arrive within hours in hilly areas, while river floods in low-lying plains build over days. Each needs a different lead time.
Many hands
Weather, water, disaster-response and local agencies each hold part of the picture.
Open data to start from
Public sources such as NASA satellite fire detections, Open-Meteo weather and air quality, and OpenStreetMap villages and protected areas can be combined on one map.
General background only. Specific agencies, data, thresholds and procedures will come from stakeholders during discovery.
What is the current issue?
Four scope areas, one shared problem: risk data does not turn into action fast enough.
The issues under each area are working hypotheses to test with stakeholders, not findings.
Connected data
Rainfall, water levels, spatial layers and field reports in one place
Rain, river and map data sit with different agencies, in different formats and update cycles.
Gaps, duplicates and odd readings are spotted by hand, if at all.
Field reports arrive by phone and chat and are hard to place on a map.
AI opportunity. One ingest step that maps every source to a common schema and flags gaps and outliers before scoring.
AI-driven workflows that end with a person's decision.
Each workflow starts from work response teams already do. Rules and models do the watching and drafting; a named person decides what happens next.
From scattered feeds to one checked dataset
New readings are mapped, timed and checked before they reach a risk score, so people trust what they see.
1 / Connectors
Pull each source
Rain, river, spatial and population data arrive on their own schedules.
2 / Data layer
Map to one schema
Fields, units and time zones are aligned, and each reading is placed in an area.
3 / AI checks
Flag what looks wrong
Out-of-range values, gaps, duplicates and dated tables are flagged with a reason.
4 / Data officer
Keeps or excludes
Decides on each flagged record, with the reason in front of them.
5 / Outcome
Ready for scoring
A checked batch with its age and flags, logged for audit.
Tools the system calls
fetch_source(source)
map_to_schema(record)
flag_quality(batch)
log_audit(event)
Illustrative function names for a pilot design.
Today
Each source is checked in its own tool, and odd readings are noticed late, if at all.
With AI
One checked dataset with every gap and outlier flagged before it can move a score.
The intelligence layer
One platform under all four scope areas.
The four areas share one data layer and one set of AI services. Data flows up; approvals and the audit log wrap every step.
Data sources
Public sources, combined on one map
NASA satellite fire detections
Open-Meteo weather
Air-quality model
Villages and protected areas
Forest-loss reference
Intelligence
Rules and models score, the agent drafts
Ranked risk scoring
Score breakdown
Fixed rules
Message drafting, Thai and English
What people use
Each role sees its own view
Command dashboard
Risk map
Alert desk
Response checklist
Situation reports
Audit log
What would the user see?
The command centre.
The opening screen is a real map, not an empty one: satellite fire detections for Chiang Mai and Chiang Rai on 28 March 2026, ranked by risk score. Click a fire to see why it scored what it did, or ask a suggested question.
Click a fire cluster on the map
Open its score breakdown
Ask a suggested question
Check the smoke forecast
Loading satellite detections…
Disaster AlertChiang Mai · Chiang RaiThailandIndiaDuty officer
Decision support · not an official warning · fire data NASA FIRMS · incidents synthetic
Duty officers
See which fires threaten villages first and why, then approve, edit or hold each drafted advisory.
Area officers
See the nearest fires with distance and wind direction, and report back from the field.
Decision makers
One shared map and a drafted situation report for each meeting.
Data and GIS teams
Manage sources, quality flags, layers and scoring weights.
Key screens
Key screens, one for each focus area.
Each tab opens the same app on a saved archive day: the briefing, a fire's score breakdown, fire danger, smoke and forest loss. The satellite detections are real; incidents and responses are illustrative.
Click a fire cluster on the map, or a card in the panel, to open it.
Loading satellite detections…
Disaster AlertChiang Mai · Chiang RaiThailandIndiaDuty officer
Decision support · not an official warning · fire data NASA FIRMS · incidents synthetic
The morning briefing: one ranked list instead of a thousand hot spots. The scores come from a fixed rule over real detections, wind, villages, protected areas and slope.
What comes next?
From demo to pilot to production.
This page is the concept and working demo. Pilot scope, data, budget and timeline are agreed only after stakeholders have seen it.
Done
Issue and problem
The scope areas this solution covers.
We are here
Concept and working demo
This page, on a real archive day of fire detections.
Show the idea working, so stakeholders react to something concrete.
This page with working screens
Real archive day, synthetic incidents
Walkthrough for stakeholders
Output: a stakeholder-ready demo.
Pilot
Next
One agreed area, real data where access allows, run alongside today's process.
Data-source assessment: datasets, APIs, access and licence terms for GISTDA, ThaiWater and data.go.th
Pilot area and first users
Thresholds and warning levels from the responsible agency
Approval flow and alert channels
Success measures agreed before the start
Output: a scoped pilot with agreed measures.
Production
Later
More areas and sources on the same platform, then prediction and a digital twin.
Connections to agency systems
Prediction models, then a digital twin
Hosting that meets security rules
Monitoring, support and model updates
Output: a supported service.
Measures to agree for the pilotTime from threshold to approved alertData age at scoring timeAlerts later judged unnecessaryResponse tasks closed on time
Built for public safety
Trust and honesty about what this is.
Anyone acting on a flood alert will ask where it came from and who signed it off. The design answers that from the start. The list on the right is what we need from stakeholders before a pilot.
This is a prototype
Answers are pre-written from a saved archive day, not live. Risk scores are a fixed, transparent formula.
Real detections, made-up incidents
Fire detections are real NASA FIRMS data for 28 Mar 2026. Incidents, people and teams are synthetic. Nothing here is an official warning.
The AI drafts, people decide
No public alert leaves the system until a duty officer has read and approved it.
Every score explains itself
Each area shows the layers, weights and readings behind its score, so it can be challenged.
AI Flood and Disaster Alert System. Next: a pilot definition.
Review the demo with your team.Tell us what a pilot must prove.
The fire detections in this demo are real satellite data for 28 March 2026; the incidents, scores and responses are illustrative, not a forecast or an official warning. This page is a demonstration, not an official system of any agency. For real warnings, follow official channels.