AI Power Demand Forecasting,demand forecasts in plain words.
An AI assistant for grid operators and power planners. It reads live grid load and weather every few
minutes, forecasts demand 48 hours ahead with a likely range, checks every forecast against what actually
happened, and explains the numbers in plain words. It supports decisions and never controls the grid.
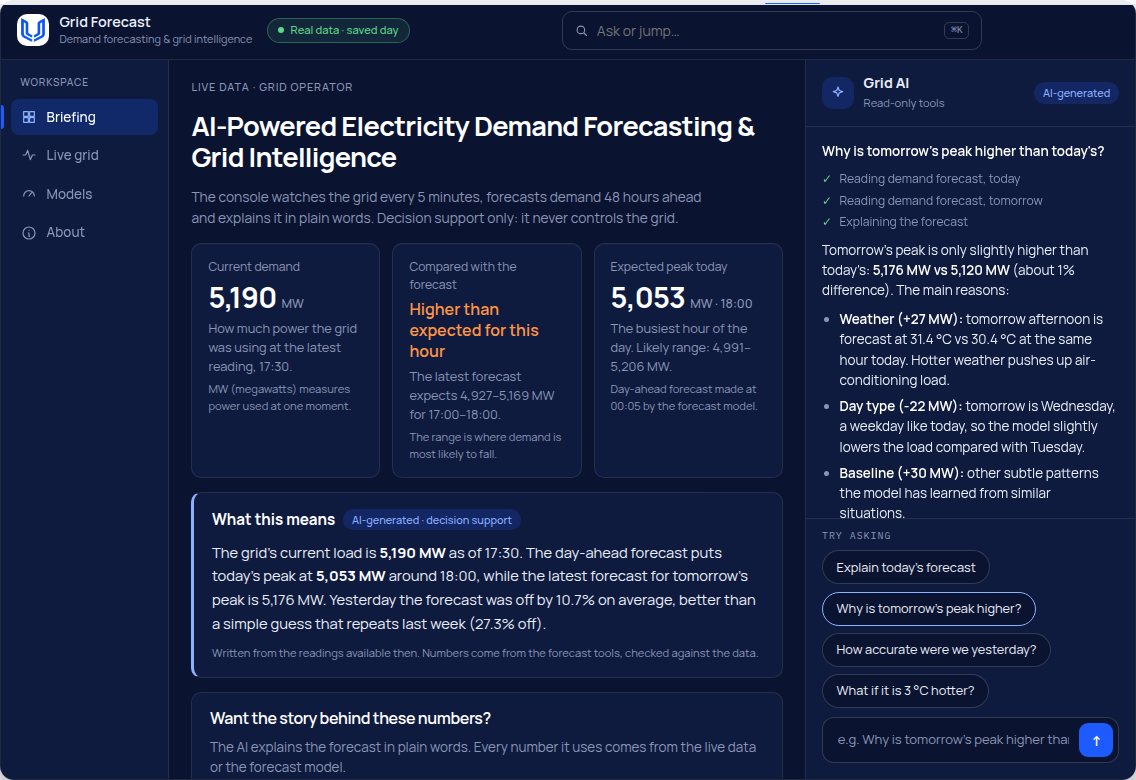
The grid console on a saved day of real load data. The live demo further down is the same console.
The context
Grid planning runs on knowing tomorrow's demand, and trusting the number.
Grid teams work from live load, weather feeds and the previous day forecast. The AI opportunity is to forecast
further ahead, show how good the forecast really is, and explain it in words a planner can use.
Demand swings hard
Demand can fall to well under half of peak on a quiet night and set a record on the hottest day. Heat, humidity, holidays and festivals all move it.
Power is bought a day ahead
The grid team must know tomorrow's demand to buy enough power and keep spare capacity for the peak. Too little means power cuts, too much means paying for power nobody uses.
Weather drives demand
Temperature and humidity move cooling load, so a good forecast reads the weather as well as the load.
The data is scattered
Load sits on the operator's website and weather elsewhere. Turning them into a forecast and an explanation takes time a control room does not have.
General background, not engineering or trading advice. Specific systems, data feeds and volumes will come from the operator during discovery.
What is the current issue?
Four steps, one shared problem: the forecast is hard to get, hard to check and hard to explain.
The issues under each area are working hypotheses to test with grid teams, not findings.
Live grid data
Load every 5 minutes and weather every hour, in one place
Load is read from the operator website and weather from another site, then copied by hand.
Gaps and odd readings are spotted by eye, if at all.
The latest reading and the forecast live on different screens.
AI opportunity. The load every 5 minutes and the weather every hour are read and saved automatically, with the time received.
There is no comparison with simple guesses such as repeating yesterday.
Misses on the daily peak are found after the fact.
AI opportunity. Every forecast is checked against the real load and scored against two simple guesses, on past test days and on real days since it went live.
Explaining a forecast to a manager takes an analyst and time.
Why tomorrow's peak is higher is a question asked every day.
What if it is hotter tomorrow? is answered by guesswork.
AI opportunity. An AI assistant explains the numbers in plain words and runs what-if scenarios. Every number comes from the data or the model, never from the AI.
AI-driven workflows that end with a planner's decision.
Each workflow starts from work grid teams already do. Data pipelines and a forecasting model make every number, an AI agent explains it, and a named person decides.
From two websites to one saved record
The operator starts from a live picture instead of copying numbers.
1 / Data pipeline
Reads the load
Grid load is read every 5 minutes, by itself.
2 / Data pipeline
Reads the weather
Temperature and humidity are read every hour.
3 / Checks
Flags gaps and outliers
Missing readings and odd values are marked before anyone relies on them.
4 / Grid operator
Watches the picture
Sees the latest reading next to the forecast and the likely range.
5 / Outcome
A saved record
Every reading is saved with the time it was received, so any forecast can be scored later.
Tools the assistant calls
read_load(5 min)
read_weather(1 h)
flag_gaps(series)
save_reading(time_received)
Illustrative function names for a pilot design.
Today
Open the operator site and a weather site and copy the numbers by hand.
With AI
Load and weather arrive on their own, saved with the time received.
The intelligence layer
One platform under all four steps.
The four steps share one data layer and one forecasting model, so each new question reuses what is already built. Data flows up, and scoring and logging wrap every step.
Grid data
Live load and weather, saved with the time received
Load every 5 minutes
Weather every hour
Saved with time received
Gap and outlier flags
Forecast and checks
A model forecasts, scoring checks it
Demand model, 48 hours
Likely range
Nightly locked forecast
Scoring against simple guesses
Intelligence
AI explains numbers fetched by tools, a person decides
Hourly briefing
Explain a forecast
What-if scenarios
Read-only tools
AI agent
What people use
One console for the grid team
Briefing
Live grid
Models and accuracy
Ask or jump
Audit log of AI answers
What would the user see?
The grid console.
This is the grid console on a saved day of real load data: the briefing, the live grid, accuracy and an AI panel. Ask a suggested question and read an answer with its chart and numbers.
The console watches the grid every 5 minutes, forecasts demand 48 hours ahead and explains it in plain words. Decision support only: it never controls the grid.
Current demand5,190 MW
How much power the grid was using at the latest reading, 17:30.
MW (megawatts) measures power used at one moment.
Compared with the forecastHigher than expected for this hour
The latest forecast expects 4,927–5,169 MW for 17:00–18:00.
The range is where demand is most likely to fall.
Expected peak today5,053 MW · 18:00
The busiest hour of the day. Likely range: 4,991–5,206 MW.
Day-ahead forecast made at 00:05 by the forecast model.
What this meansAI-generated · decision support
The grid's current load is 5,190 MW as of 17:30. The day-ahead forecast puts today's peak at 5,053 MW around 18:00, while the latest forecast for tomorrow's peak is 5,176 MW. Yesterday the forecast was off by 10.7% on average, better than a simple guess that repeats last week (27.3% off).
Written from the readings available then. Numbers come from the forecast tools, checked against the data.
Want the story behind these numbers?
The AI explains the forecast in plain words. Every number it uses comes from the live data or the forecast model.
Or ask
Grid operators
Watch live demand against the forecast and see when it runs high.
Power planners
Plan tomorrow's purchase and the evening peak from a forecast with a range.
Analysts
See how accurate the model is and where it misses.
Managers
Get the story behind the numbers in plain words, on demand.
Key screens
One screen for each question a planner asks.
Each tab opens the same console on one page and works on its own. The load and weather are a saved day of real data, and the answers are pre-written demonstrations.
Read the briefing, then ask the AI to explain today's forecast.
The console watches the grid every 5 minutes, forecasts demand 48 hours ahead and explains it in plain words. Decision support only: it never controls the grid.
Current demand5,190 MW
How much power the grid was using at the latest reading, 17:30.
MW (megawatts) measures power used at one moment.
Compared with the forecastHigher than expected for this hour
The latest forecast expects 4,927–5,169 MW for 17:00–18:00.
The range is where demand is most likely to fall.
Expected peak today5,053 MW · 18:00
The busiest hour of the day. Likely range: 4,991–5,206 MW.
Day-ahead forecast made at 00:05 by the forecast model.
What this meansAI-generated · decision support
The grid's current load is 5,190 MW as of 17:30. The day-ahead forecast puts today's peak at 5,053 MW around 18:00, while the latest forecast for tomorrow's peak is 5,176 MW. Yesterday the forecast was off by 10.7% on average, better than a simple guess that repeats last week (27.3% off).
Written from the readings available then. Numbers come from the forecast tools, checked against the data.
Want the story behind these numbers?
The AI explains the forecast in plain words. Every number it uses comes from the live data or the forecast model.
Or ask
Current demand, how it compares with the forecast, the expected peak and a short summary written from the numbers.
What comes next?
From demo to pilot to production.
This page is the concept and working demo. Pilot scope, data, budget and timeline are agreed only after the grid team has seen it.
Done
Issue and problem
The scope areas this solution covers.
We are here
Concept and working demo
This page, with a working console on a saved day of data.
The load and weather on this page are a saved day of real data and the answers are pre-written demonstrations, not engineering or trading advice. This page is not an official system of any grid operator.